Using statistical methods in pricing to model sales volume and profit:
How to model sales volume and profit (the faster way)
Statistical methods in pricing can be used for modelling sales volume and profit. One is able to model them in a quick and simple way or a more robust and accurate way. If you have limited resources, a fast and simple method is better than nothing. This can be useful in e.g. B2B businesses where you can just estimate your sales people’s efficiency and costs and aggregate those for all of your sales representatives. The following data points are a simple example of what you need to be able to model sales volume and profit:
1. How many leads generated per representative per time unit
2. How many phone calls per representative per time unit
3. How many meetings per representative per time unit
4. How many closes per representative per time unit
5. Estimate costs for lead generation (e.g. marketing budget over time)
These data points allow you to calculate the amount of revenue generated per representative and aggregate all costs per representative to know how much profit they will bring over time.
A similar super fast and easy method can be used for online businesses by taking into account the following data points:
1. Estimate cost of marketing budget over time, e.g. 5000$
2. Estimate average cost per click, e.g. 1$ => 5000 clicks
3. Estimate conversion rate, e.g. 5% => 250 sales
4. Estimate average basket, e.g. 50$ => 12500$
5. This gives you a monthly profit forecast of 7500$
After you have put together an estimate like the one above, remember to double check it from topdown; estimate your market share and see how realistic it is. If you have a limited capacity of e.g. 200 sales per month, you can’t have more than 200 sales even if your model shows 250 sales per month.
A capacity usage of >90% is usually quite high for any business (unless you are heavily invested in automation and service scaling, on a level to a company like Amazon. If you achieve such high capacity usage on a regular basis, we congratulate you for good efforts!). In certain cases you can also take seasonality into account e.g. Christmas decorations are mostly sold before Christmas, not during summer time.
Fast and simple methods like the ones described above are all you need to have in place to get started in doing profitable business in your field.
How to model sales volume and profit
(the more robust way)
When you have more time and resources available, you can then start to consider using a more robust and accurate modelling system. For this kind of modelling to be possible, you’ll need to have systems in place to gather and record sample data points like:
1. Data of units sold per SKU (stock keeping unit) per price point over a time unit (either aggregated to a time unit or then data of each individual sale for each SKU)
2. Potential interest per SKU over a period of time (e.g. visitor tracking using Google Analytics or such)
3. Supplier data per SKU
4. Geographical location of sales per SKU
5. Data on past promotions per SKU
6. Data on customer reviews per SKU
7. Market data from competitors per SKU
8. Data of the product
Another important factor that you need to take into consideration and something you really need to know about your business is your cost structure. These typically involve purchase price as well as a attributed part of all fixed operating costs to each sale. On top of these, you also need to figure out your gross margin target.
For plotting sales volume vs. price and profit vs. price graphs and sales volume / profit vs. time it is very beneficial to use a graphing software like Excel. Remember that the values are not constant:
They change over time as the market evolves and internal and external factors change. You may for example need to have multiple price points per SKU in the data set in order for some of the graphs to provide useful information. This could be the case where you have a standard price and a standard discounted price that you switch between.
Once you have gathered enough data, you are able to calculate some simple statistical key figures that allow you to analyze the data which can lead to you acquiring some useful insight such as:
- Average sales per SKU in a time unit, e.g. 1 unit sold every 10 days in average => 3 units sold per month in
average - Sales variance per SKU, e.g. if 1 unit sold every 10 days means that you have 9 days in every 10 days when
there are no sales


With these data points and key figures you can then model your sales and profit using:
1. Normal distribution (often not the optimal choice for pricing models since it can be negative)
2. Gamma distribution (often quite good for pricing models)
3. Poisson distribution (often quite good for pricing models)
Why machine learning and AI are the future of product pricing?
AI is a buzzword like no other. We sat down, wrote all we know about it and let you be the judge. Here is a seriously indepth 50-page insights on how to use artificial intelligence in pricing. Hope you find it useful!

Why using average (mean) is not the best way to model sales volumes and profit
Average, also known as mean, is a simple statistical figure taken from a list of numbers to represent them. Depending on the usage it can be calculated in different ways. Mostly average is used to describe the statistical populations that fit a normal distribution (Bell curve), e.g. height of population.
Arithmetic mean (AM) is calculated as the sum of all occurrences divided by the number of occurrences in any data set. There are also other types of means such as: geometric mean (GM) and harmonic mean (HM), which have the mathematical properties of AM ≥ GM ≥ HM in any data set.
From now on, in this blogpost, we are going to discuss the use of arithmetic mean (AM) and just call it mean or average. If the population data set follows the bell curve, AM has the property of being equal to mode (the most common data point in a data set) and median (the 50 percentile in the data set).
AM should never be considered as the only statistical figure in any decision making due to skewness. In a data set where a large majority of values are small, a sufficient number of large figures can skew the data set to the right. If you at this point assume that you are dealing with an un-skewed normal distribution your decision making will be compromised. The same scenario is also true in an opposite situation where the majority of the data points are large and a significant number of small figures will then skew the data to the left.
AM also has a hard time dealing with sales estimates where sales are infrequent, which can happen quite often. Here are a few scenarios that illustrate the problem of using AM in sales forecasting:
Scenario A)
Scenario B)
Scenario C)
1 sale occurring every 10 days means that there are 3 sales in 30 days (1 month), 30 sales over 300 days, 27 sales days in a month are “empty” sales. Mean is now 1/10 sales per day.
3 sales occurring on one day in a 30 day period (1 month) means that there are 29 sales days with empty sales in one month (30 sales over 300 days). Mean is still 1/10 sales per day.
30 sales occurring once in a 300 day period means that there are 299 days with empty sales in that period. Mean is still 1/10 sales per day.
In all three scenarios the calculated mean is nowhere near reality and if this would be the method you would use it would lead to you either not having stock when you need to, or having too much.
Now that we’ve looked at the challenges of using average in forecasting sales volumes and profit, it is time to turn to something more positive and see what the optimal distribution model would look like.
What is a good distribution model for forecasting sales volumes and profit?
Since normal distribution poses some challenges it is good to find a model that takes into account both average and variance. This way you’ll get more information about how sales are distributed over time.
The following part should provide you with enough information whether you can use normal
distribution in your sales modelling or not.
- Normal distribution can sometimes be useful for SKUs that have a high volume or high frequency of sales per time unit
- Normal distribution is less useful for SKUs that have a low volume or a a low frequency of salesper time unit


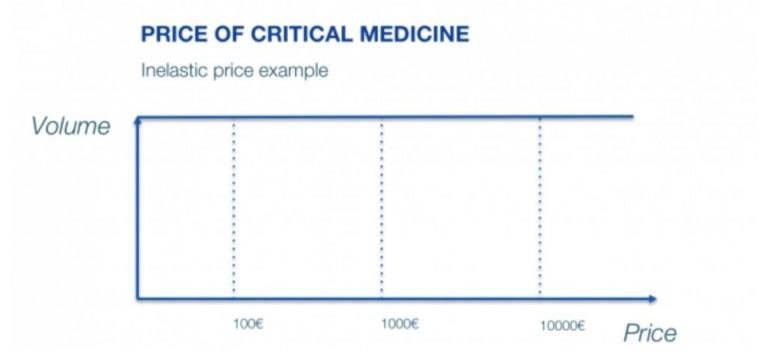
Inelastic products do not react on price changes. Example is on critical medicine like insulin or Covid-19 vaccine.
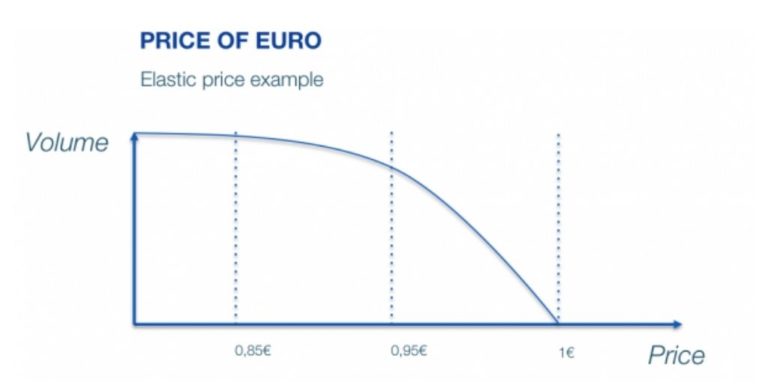
Elastic products do react on price changes. Example of 1€ coin to be sold less than 1€.
If you lower the price of a product, you are likely to sell more units. This in turn will create an S-shaped curve when the price is lowered and then again raised.
Normal distribution has the problem that it can be negative in such cases if we start the slope at zero. If we would want to create something that looks like a Bell curve, we would need to start at a low price point and that would have to lead to low or no sales, then increase the price to mid level and see the highest sales and then again raise the price and see lower sales. This is of course very unlikely to happen which again proves that the Bell curve is rarely a very realistic outcome.
With infrequent sales over a period of time, it is often more useful to use a probability distribution to model sales, profits and pricing. Here are a few examples of good statistical models for forecasting sales volumes and price, especially if your sales are infrequent during certain times:
Poisson distribution
Gamma distribution
Negative binomial distribution
To model the # of events in the future, for discrete usage (e.g. sales occurrences). For example, if you buy infinite amounts of lottery tickets, the distribution of winning tickets is Poisson distributed.
To predict the wait time until future events occurs (for any number of future occurrence, not only the first occurance).
When buying two lottery tickets, the probability of winning is modelled with binomial distribution. When the sample size increases, it will start to look very much like Poisson. (combination of Poisson and Gamma)
Like Lumen learning says, Poisson is “a discrete probability distribution the probability of a given number of events occurring in a fixed interval of time and/or space if these events occur with a known average rate and independently of the time since the last event”. This applies very well to people buying stuff, and thus purchase behavior can be modelled with Poisson.
Hoarding of certain products results in over dispersed data, which can be modelled with negative binomial distribution. When the sample size increases, the distribution will start to look very much like Poisson.
Thus Poisson or gamma or binomial distribution or a combination of some or all of them is a good choice for modelling. Just remember to take into account seasonality and promotions and all other price changes in your models.
Learn more about e-commerce pricing
All things e-commerce pricing & price optimization right in your inbox. No spam.


